Zone: everywhere at once
The rest of show day, on the same spine
Accreditation answers who is allowed where. Show day is everything else: the fence gap behind the bar, the caterer's cover count, who sleeps where, what time doors move to. Bloop runs those off the same people and event records, so nothing lives in a second system, and the snags land on your own site plan rather than in a radio log.
Live site issues
Raised from any phone, pinned to the plan
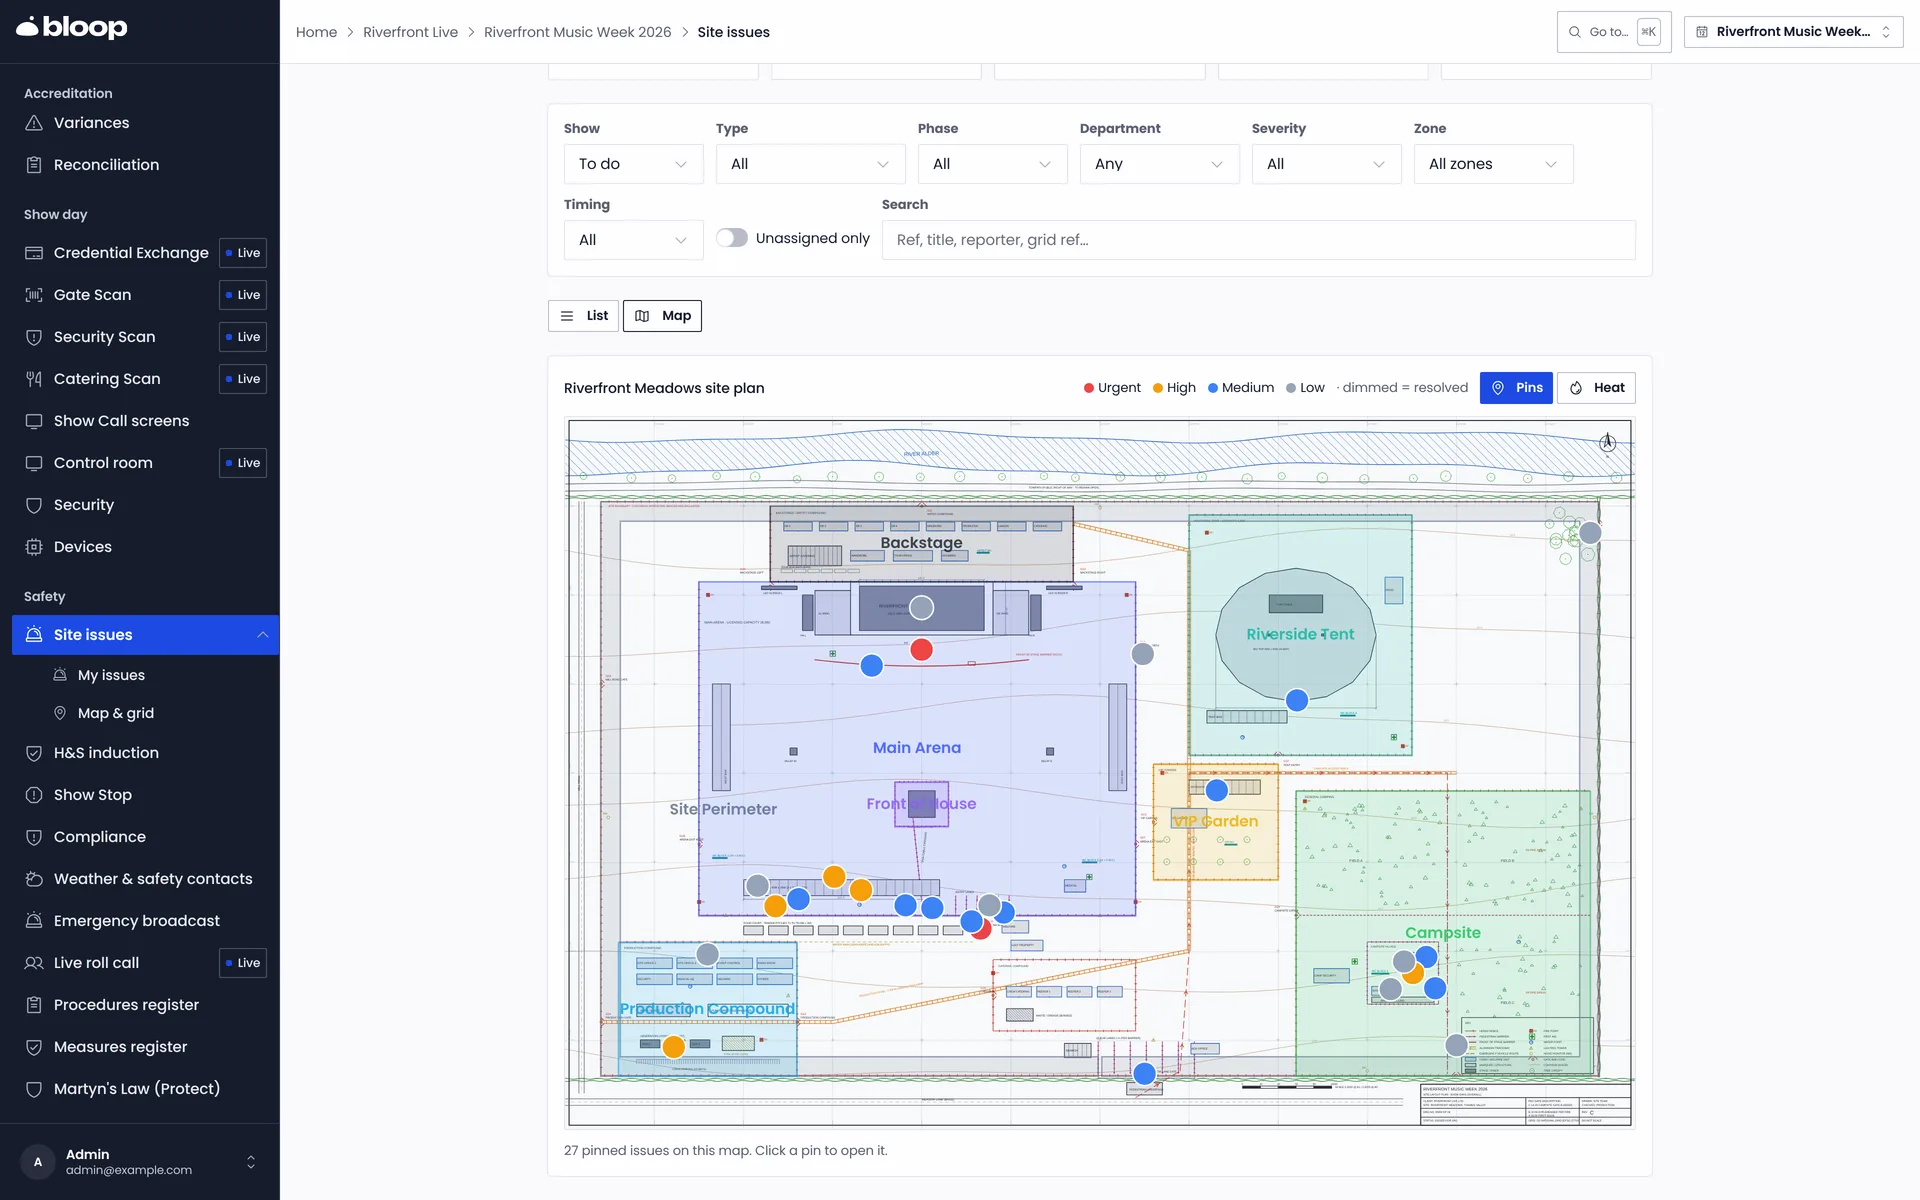
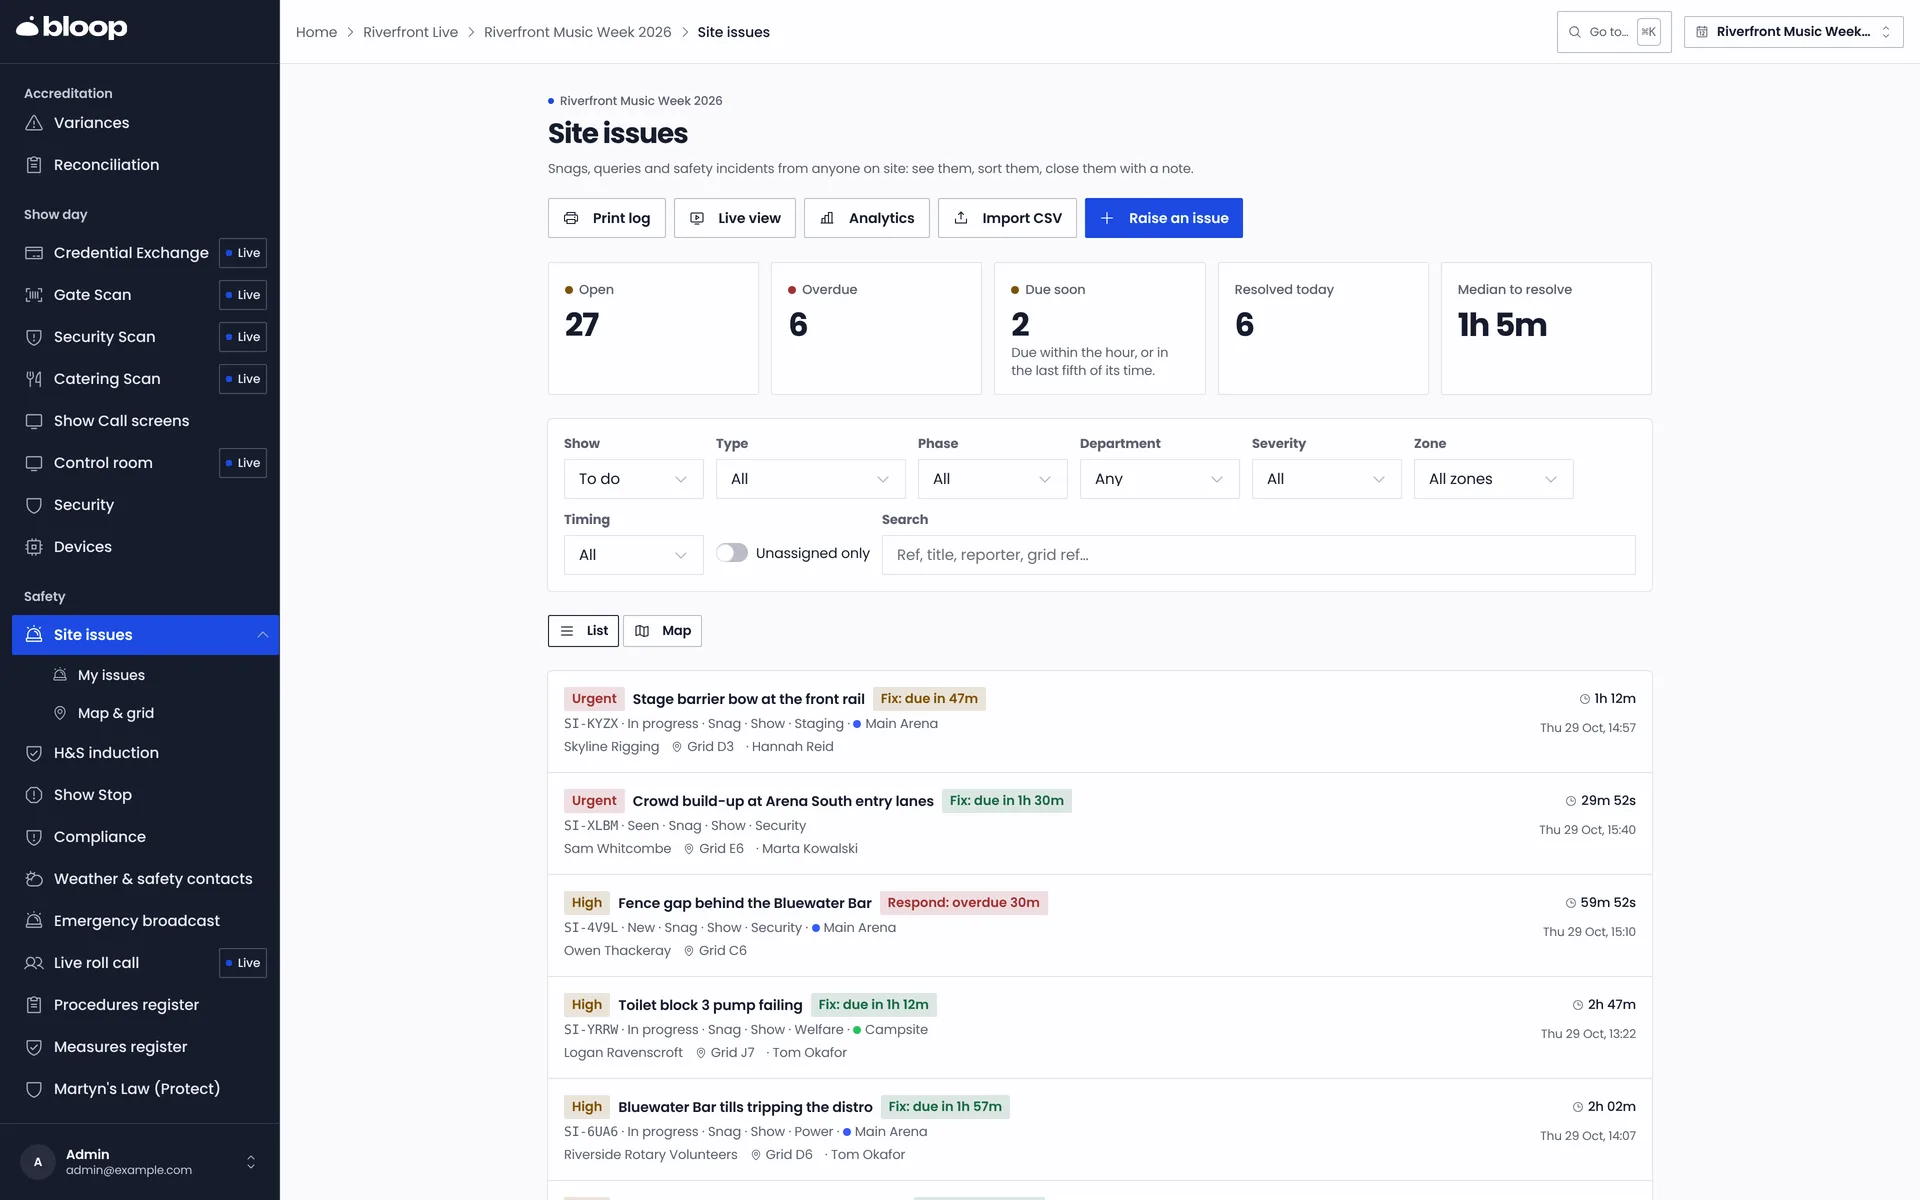
Anyone on site raises an issue in seconds: a title, a photo, a tap on the plan or a GPS fix, and it lands with a grid reference the radio already understands. It routes to the right department with a severity and a reference code, and the reporter can follow it from their credential.
Your own CAD site plan
Upload the plan as a DXF straight from the CAD package, or as a plain image, and set the grid over it. A DXF is georeferenced from its own coordinates, so a phone's location resolves to the same square the drawing shows. Zones are drawn on the plan too, and an issue inherits the zone it sits in.
A heat view of where the trouble is
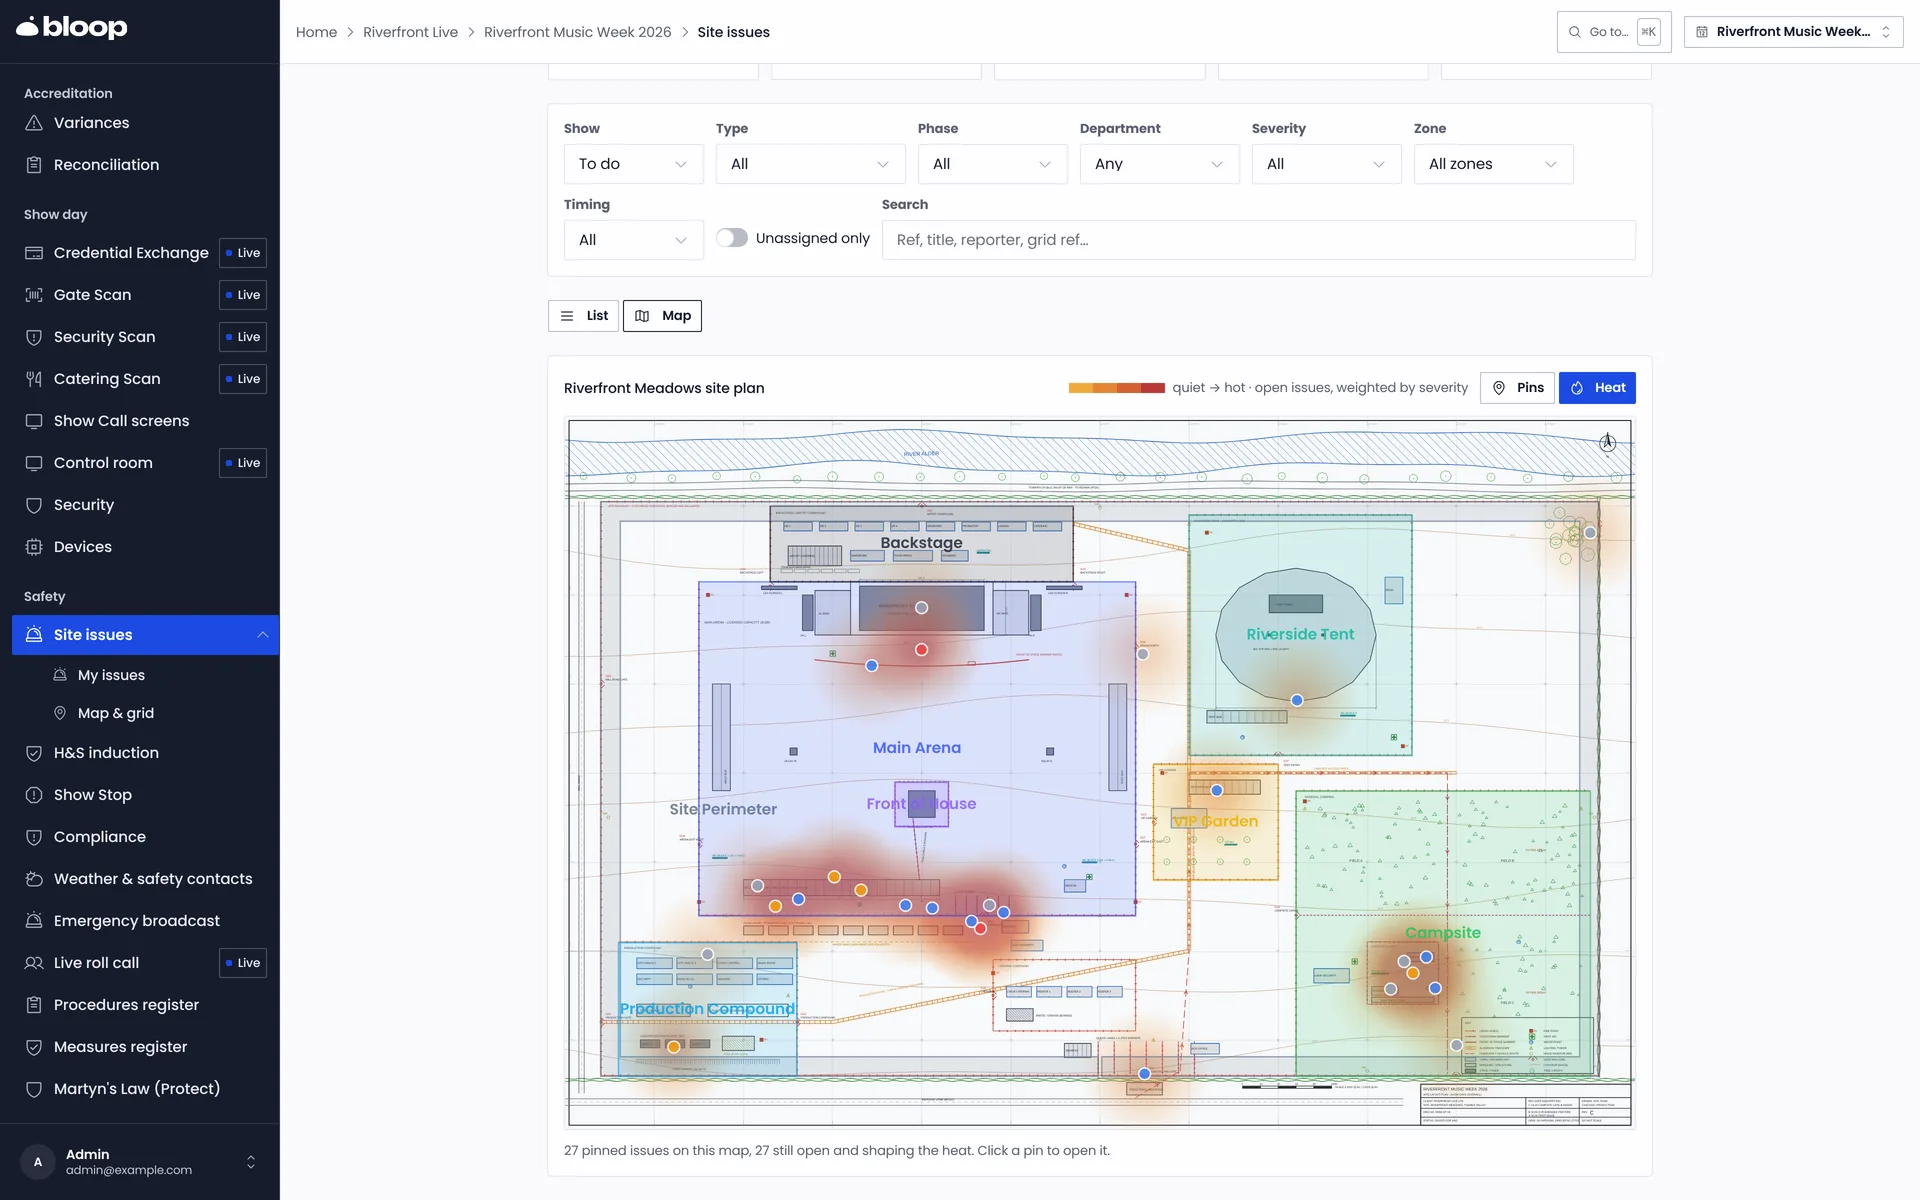
Flip the map from pins to heat and the open issues, weighted by severity, become a picture of the site. The bar that keeps breaking and the gate everyone complains about show up as the hot spots they are, and a tap on the plan goes straight to the record beneath.
A clock on every one
Every severity carries a target to acknowledge and a target to fix. Overdue is recorded against the clock, so the morning meeting starts from what is actually late rather than what was loudest on the radio.
The wall in event control
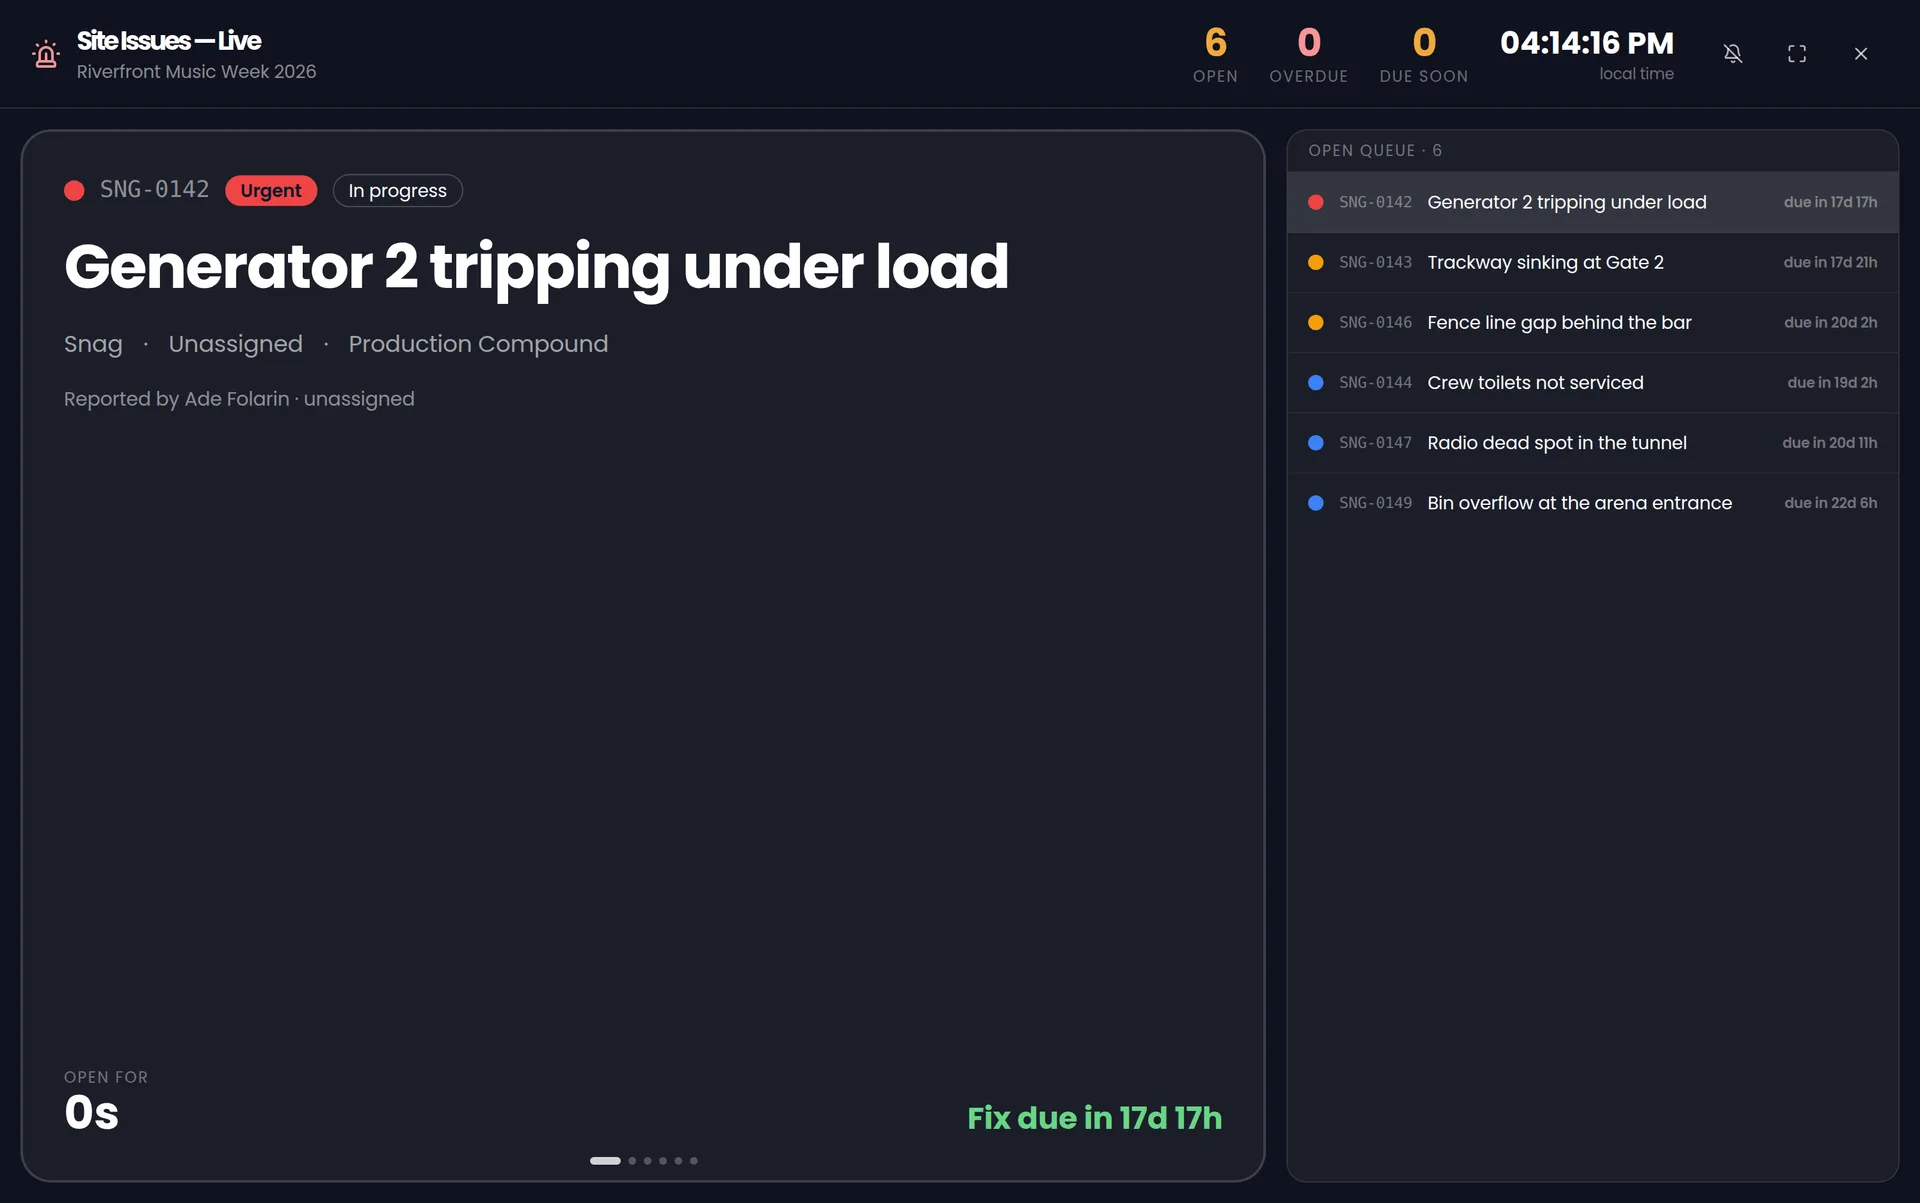
The live wall runs on any screen in the production office: what is open, what is ageing, what was just fixed, refreshing on its own. Nobody has to ask for an update because the update is on the wall.
The debrief writes itself
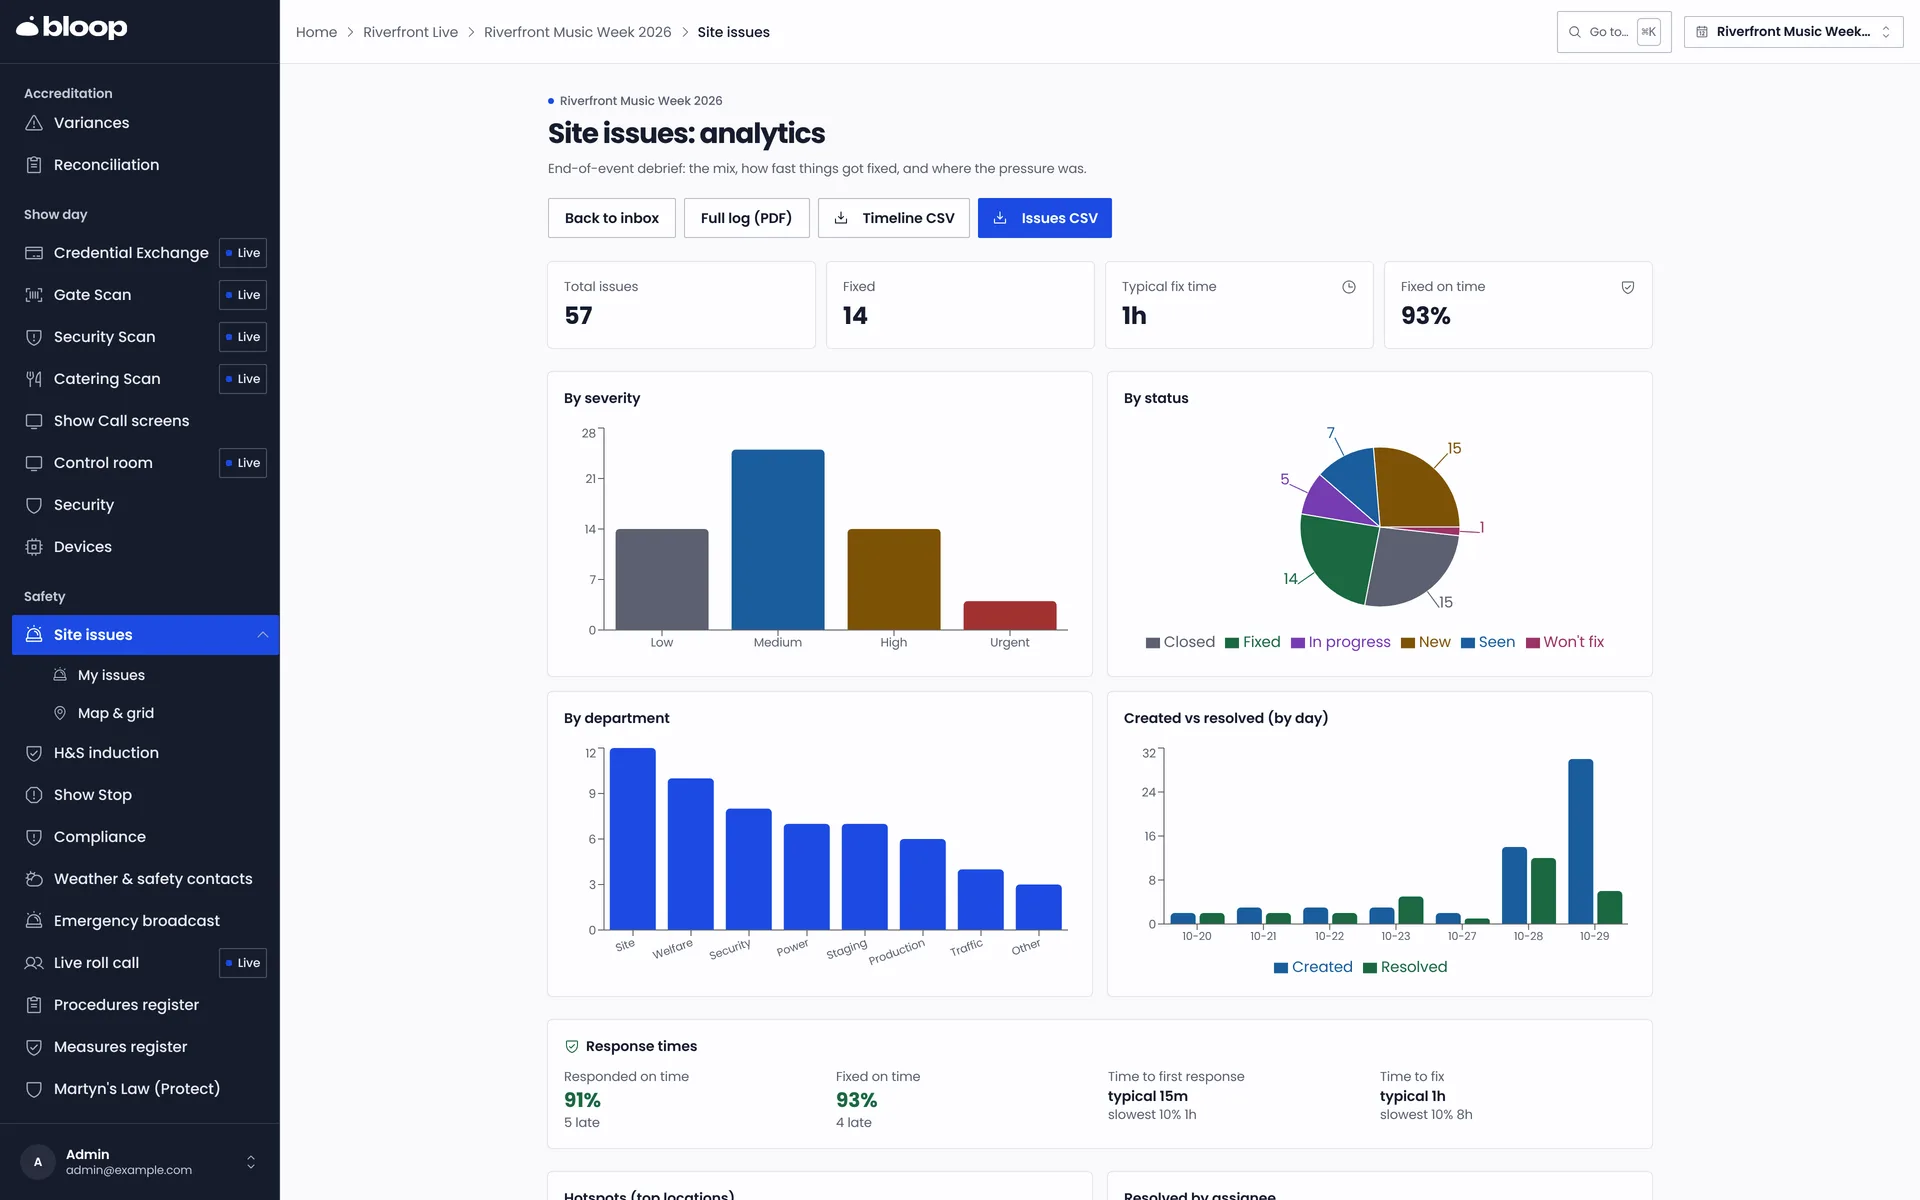
Issues by department, by location and by time to fix, from the record rather than from memory. Last year's snag list imports from a spreadsheet, so the comparison is there from the first build day.
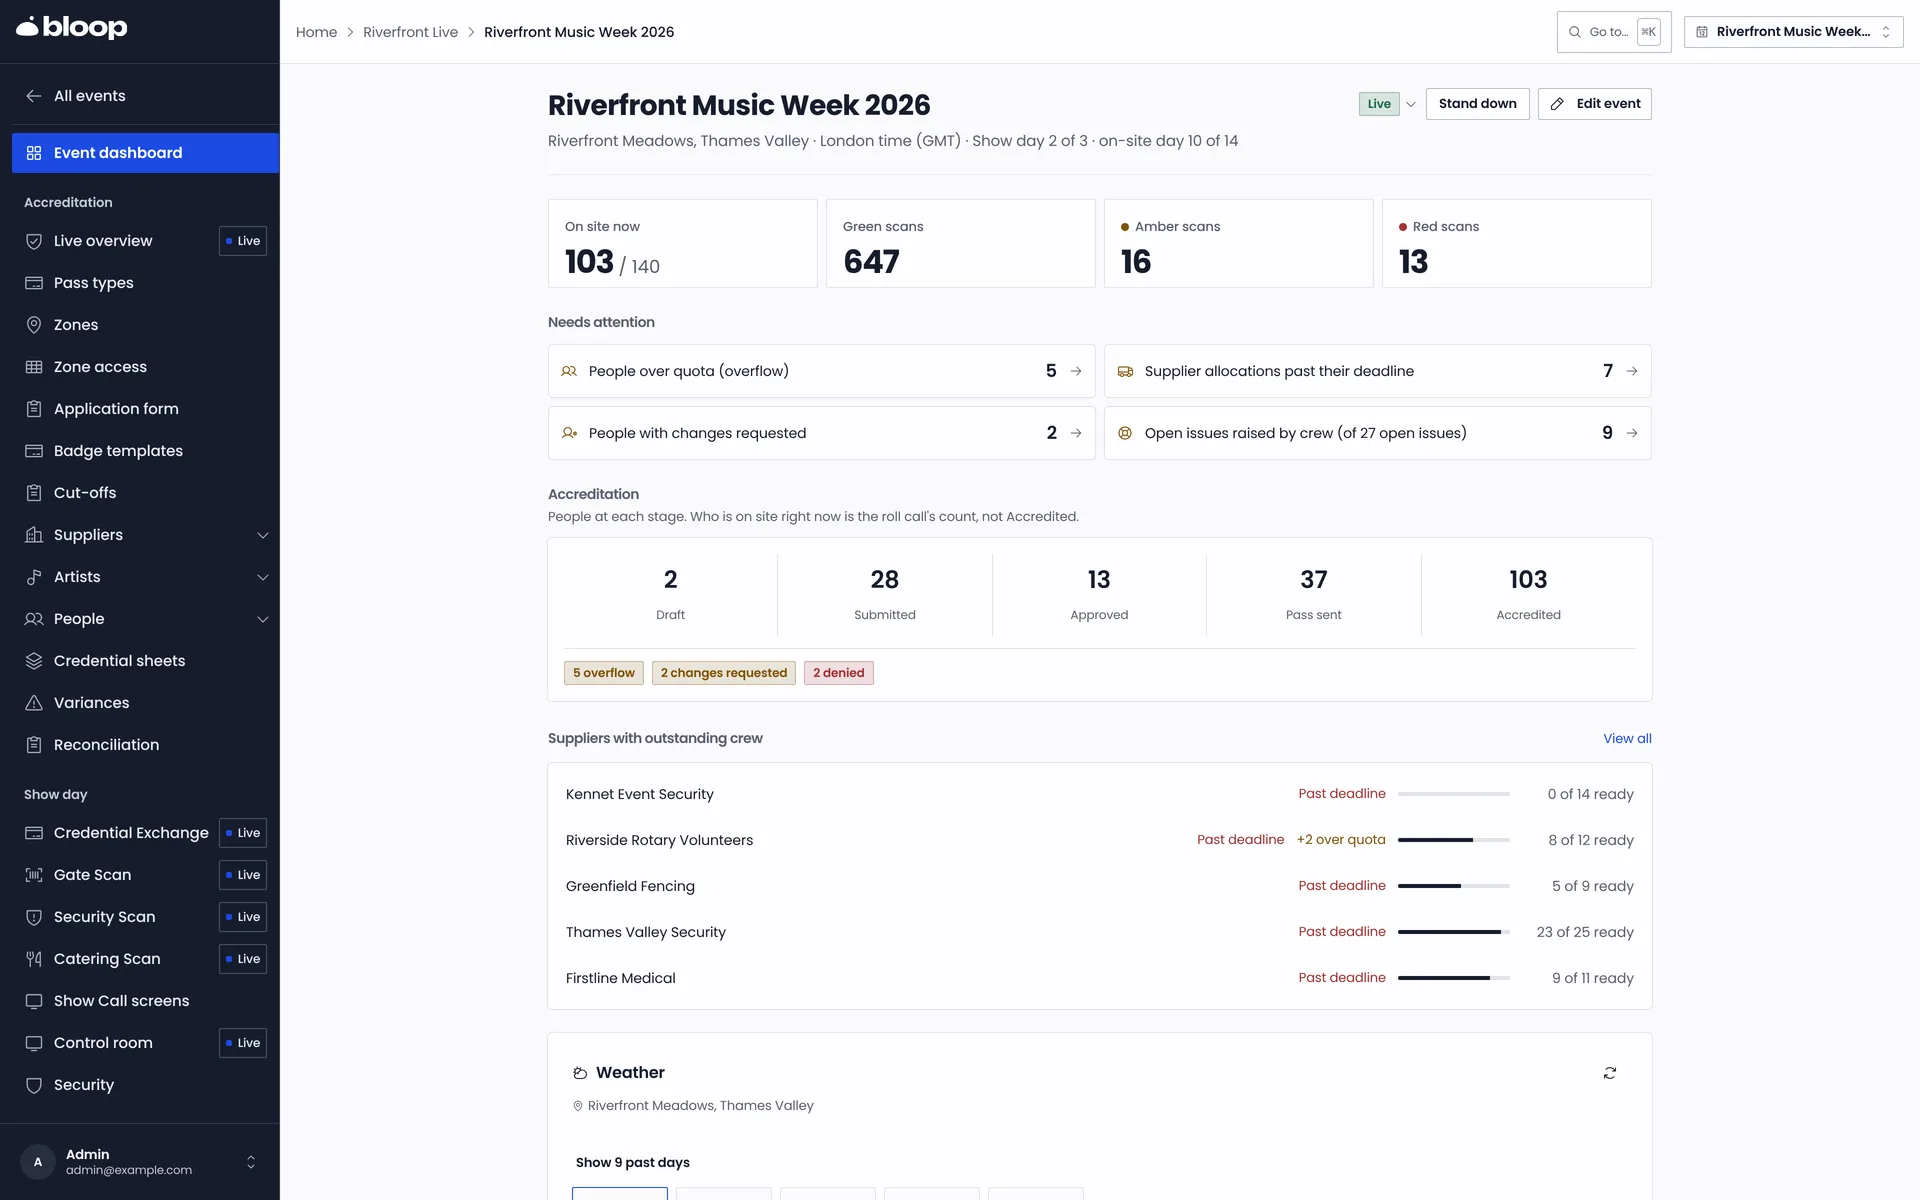
Not mockups. Real screens from Bloop, running a sample event with invented data.
Show day ops
Catering covers without the argument
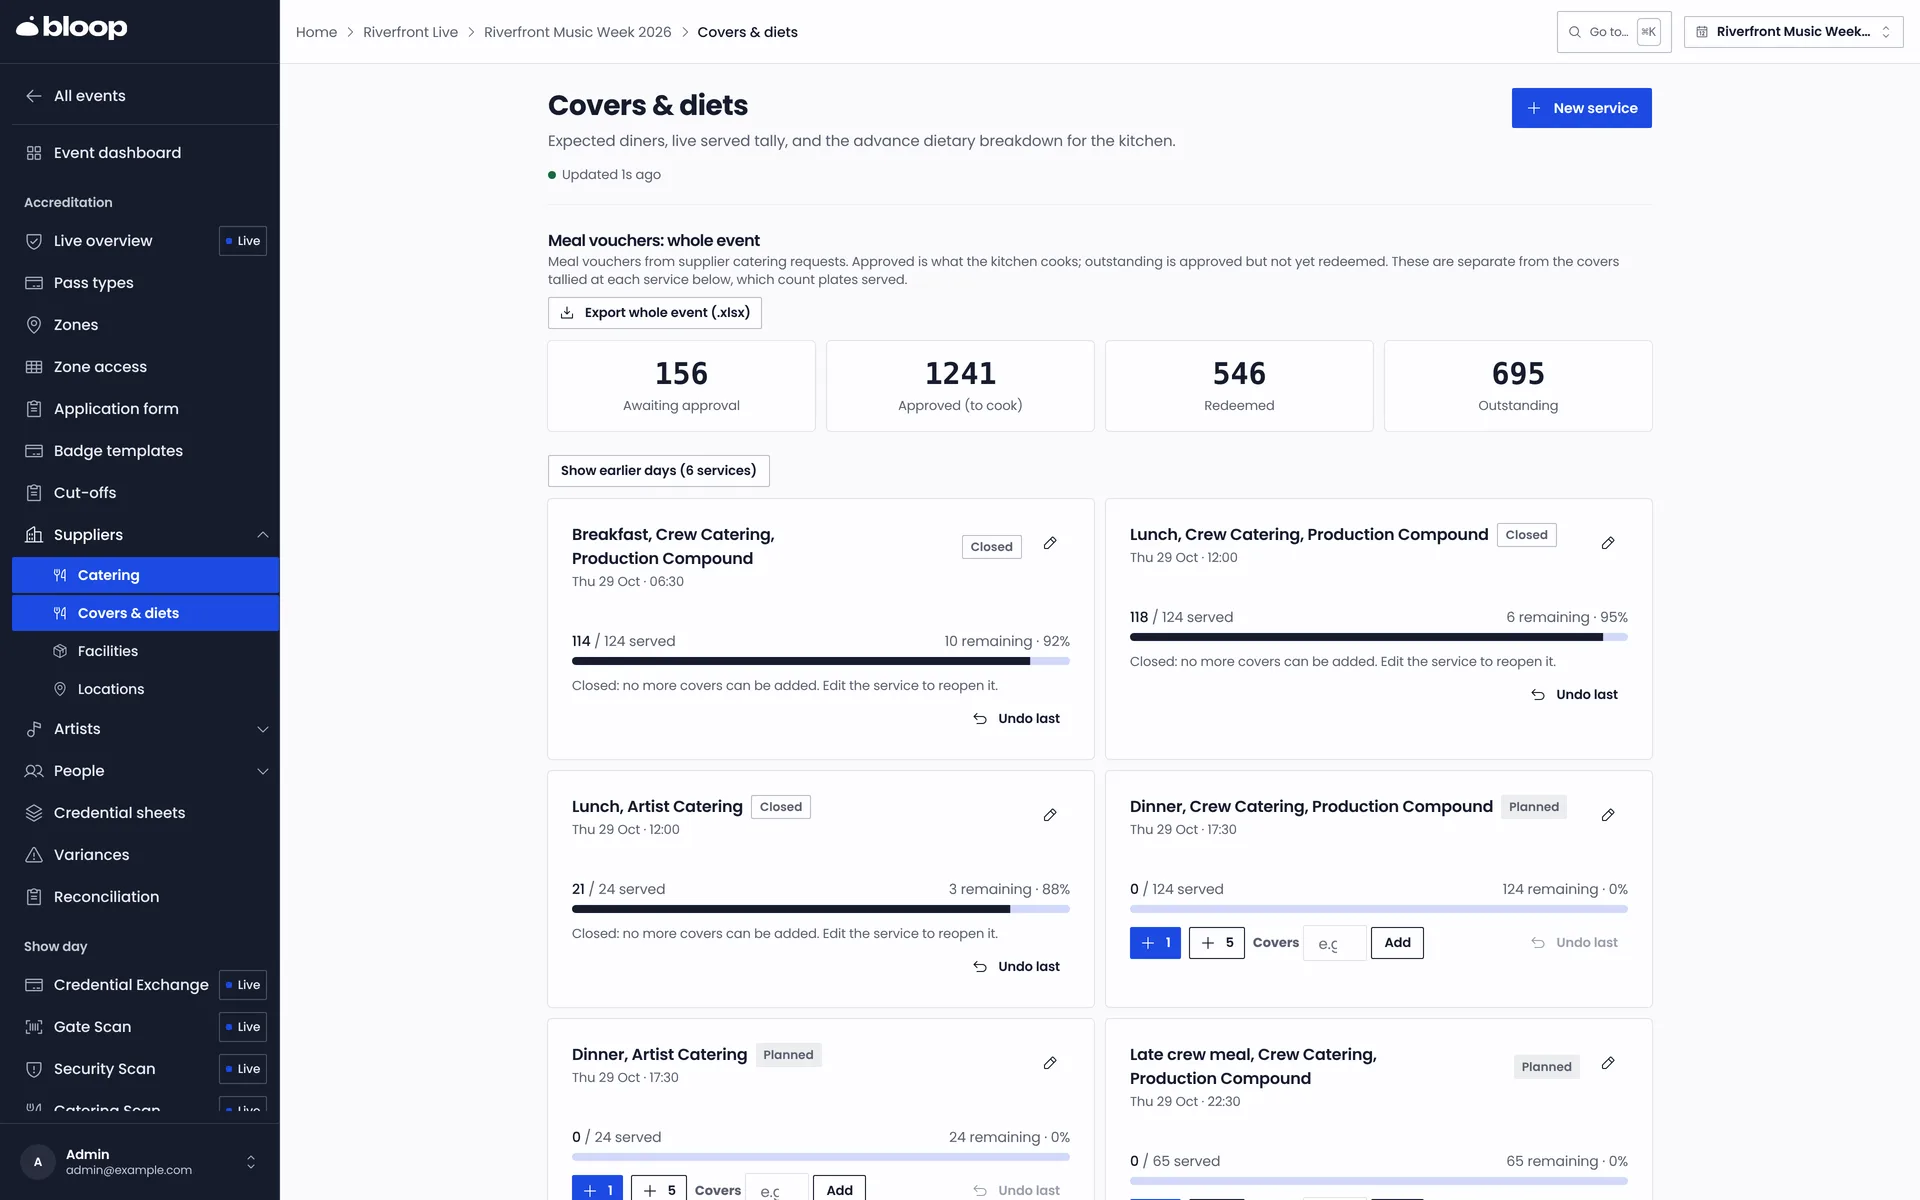
Meal entitlements ride on credentials and are redeemed by scan at the catering point. The caterer sees live cover counts by day and meal; you stop paying for the headcount guess.
Accommodation, against real people
Room blocks and allocations run against the same person records as everything else, so the rooming list never drifts from the crew list it was copied from.
Schedule, show call and show stop
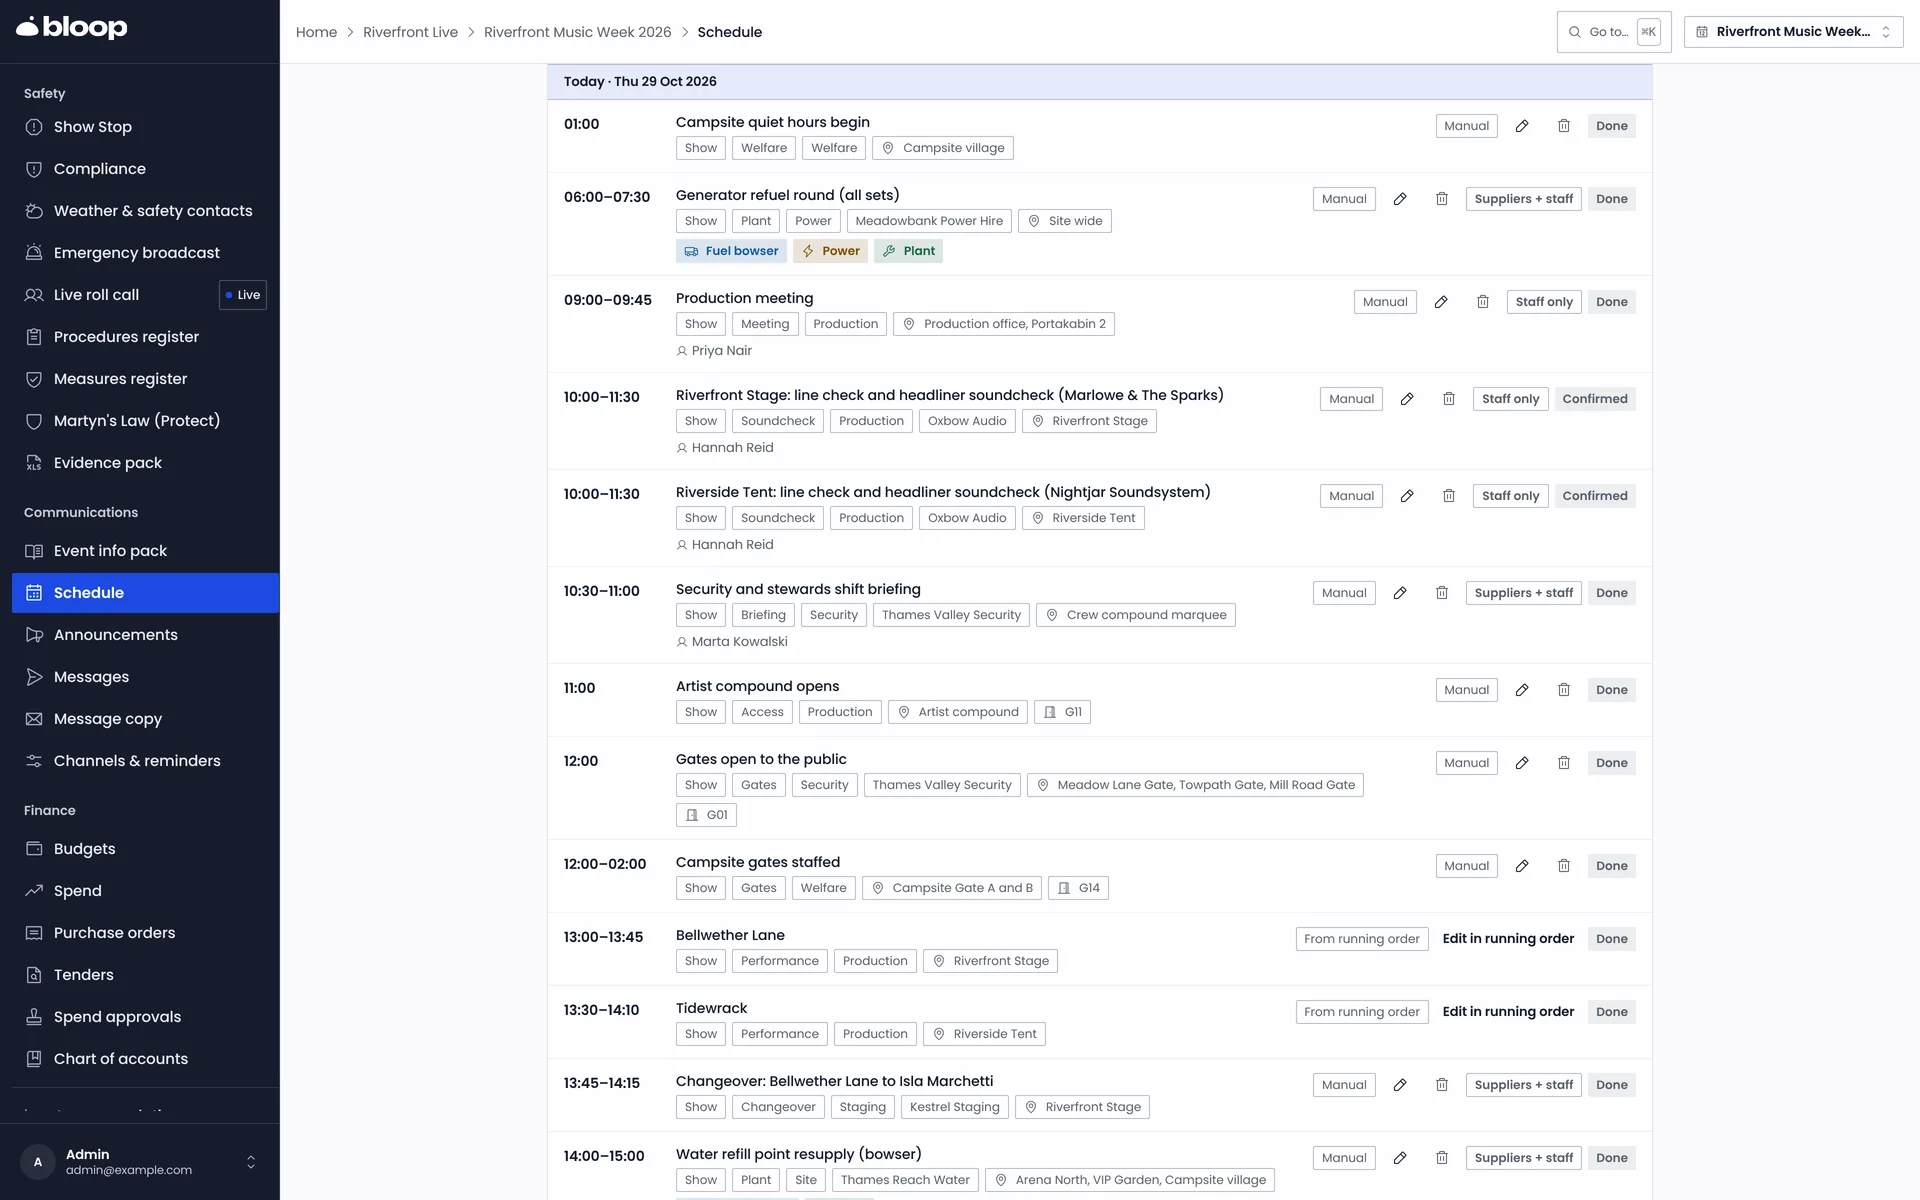
The production schedule lives in Bloop (or syncs from the master sheet), show-call screens run on any backstage display, and the show-stop procedure is one deliberate click away, logged when it happens.
Facilities orders in one place
Cabins, fencing, plant and the hundred other things on order, tracked with quantities and suppliers rather than living in a thread.
Messaging that reaches the right pocket
Group messages to exactly the slice of people you mean (a supplier's crew, a department, everyone on site tomorrow), reusable templates, and an event info pack everyone can reach from their credential.
Not mockups. Real screens from Bloop, running a sample event with invented data.
How it works
How it works, step by stepStep 05 of 07Issue passes
QR, NFC or both, straight into Apple Wallet. A pass only works while its conditions are met.
Step 06 of 07Show day
Gates scan with or without signal. Live counts, guest lists and catering covers from the same record.
Step 07 of 07Close and carry over
Reconcile, sync purchase orders to Xero, keep the audit trail and roll the event into next year’s template.
Start today
Run the next show from one record. Free for up to fifty accredited people a year. No card needed.